Debugger
One of the key features of Nuclide is its multiple-language debugging support provided with a debugger interface inspired by the familiar Chrome DevTools. The Nuclide Debugger provides many capabilities allowing you to have a productive debug loop, including inspection, watches, setting breakpoints, step in/over/out, etc.
Instantiation
Attach to a running debug target via Cmd-Shift-A (Ctrl-Shift-A on Linux and Windows). You can also
toggle the Debugger through the Command Palette and the
Nuclide toolbar’s Toggle Debugger icon. You can also launch a new target with the debugger
attached via Cmd-F8 (Ctrl-F8 on Linux and Windows).
You can also bring up the Debugger panel by choosing Debugger -> Show from the Nuclide menu.
Basics
Nuclide supports debugging for multiple languages and platforms. However, there are some basic debugging concepts that apply across all languages.
Debuggable Target
Specific details are provided for each language or platform, but in general, to begin debugging code in Nuclide, you need to either launch a debug process from within Nuclide (e.g., iOS from the Buck toolbar) or attach to a currently running process for debugging.
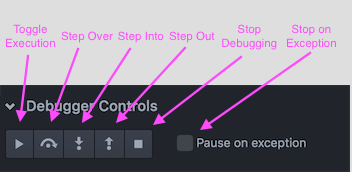
After attaching to the process by clicking Attach, you should see the Debugger Controls to the right of the Editing Area.

Breakpoints
To set a breakpoint in Nuclide, you use the gutter. Click to the left of each line number in the file(s) in which you want Nuclide to break the running program. Then as the program is running, if a line on which a breakpoint is set is hit, the program halts, and you are able to perform debugging tasks such as step and evaluation from that point.
There is currently only one type of breakpoint called a source breakpoint. This is a breakpoint on one line of code. We are looking into ways to support functional, conditional, and other types of breakpoints.
Debugger
The Debugger Controls are the information control center for the Nuclide Debugger.
In addition to the specialized areas described below, it also provides mouse-clickable execution, stepping, and breakpoint options.
Call Stack
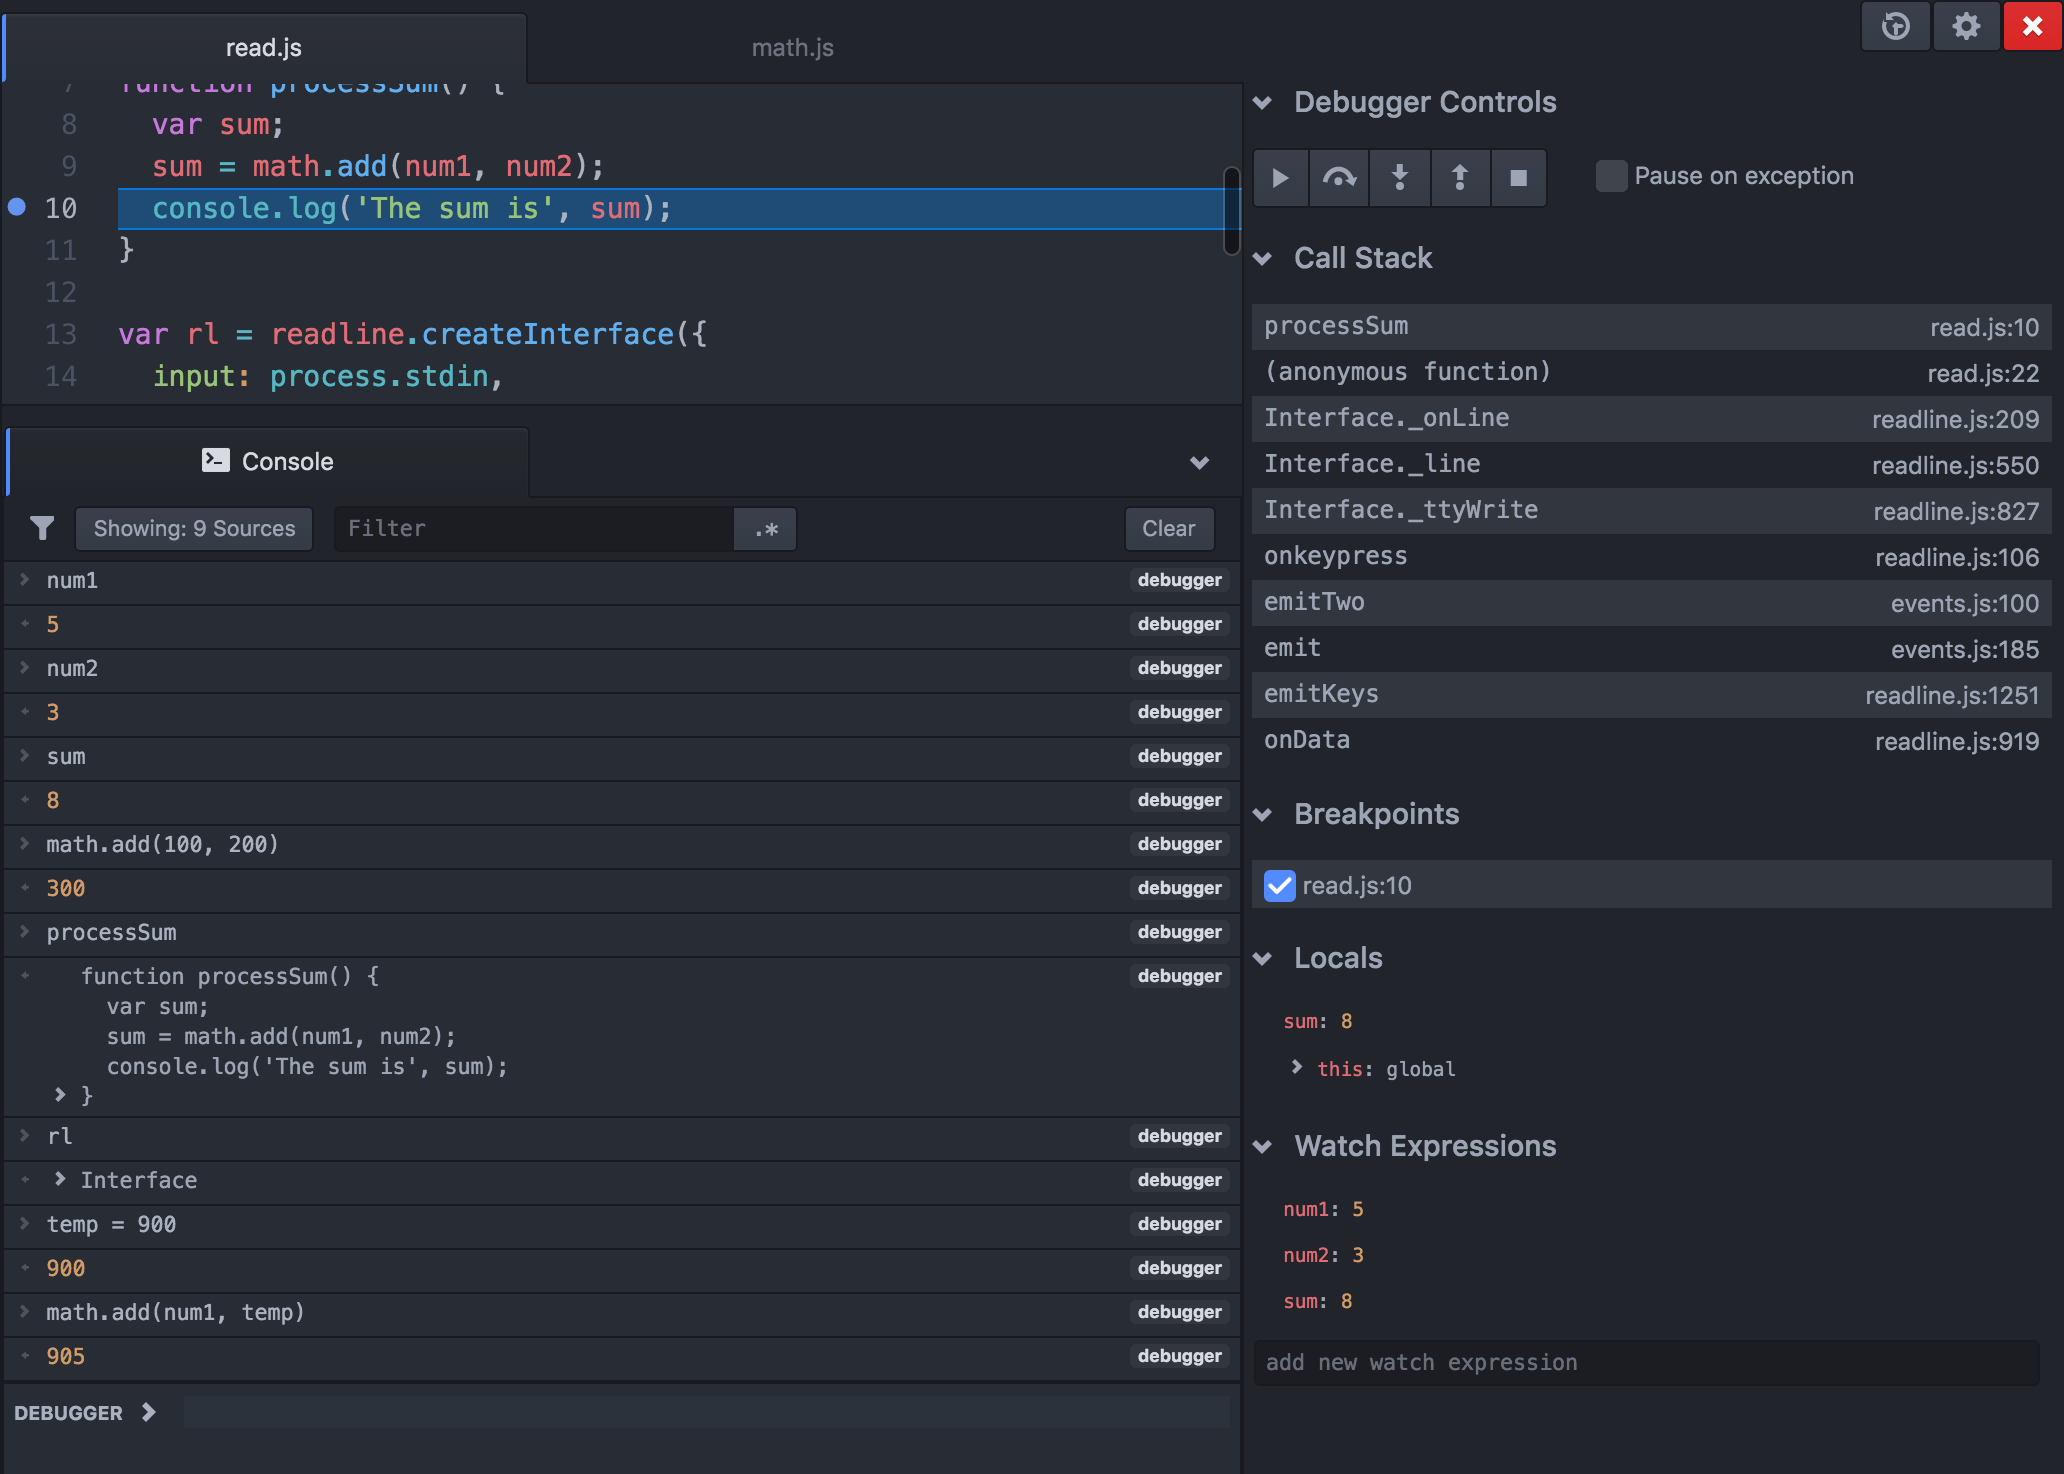
The Call Stack area shows you where you came from to get to your current point in the code. The top function is where you currently are, the function below the top is the one that called the current function, and so on. Clicking on any function in the call stack will change the scope information so that it is relevant to that function.
Breakpoints
The Breakpoints area shows you all the places in your project where you have breakpoints set. If any are highlighted, that means that you have now hit that breakpoint while running the code. Clicking on a breakpoint in this list will move your cursor to its line of code in the Editing Area. You can deactivate/reactive breakpoints by clicking the checkmark next to each one. Right-clicking in the area will give you the option to quickly remove, enable, or disable all breakpoints at once.

Unresolved Breakpoints
These are breakpoints that cannot be resolved by the debugger. The most likely cause of an unresolved breakpoint is putting a breakpoint on code that is not part of the project on which the debugger process is attached. For some languages, this can also indicate that the program was built without debug symbols (check your compiler flags!), or that the symbols are missing or do not match the binary being debugged.
Scopes
The Scopes pane shows you information about variables based upon the current point in the running of the code. Which scopes are visible depends on the language being debugged.
Watch Expressions
The Watch Expressions area is for you to keep track of the values of global and local variables. To add a new value to track, enter it in the add new watch expression text box. To remove a watched variable, click the x icon of the variable you wish to delete.
Detaching
You can detach the debugger from the current process by clicking “X” to close the debugger controls pane, or by clicking the “stop” button. This will stop the entire debugging session for that process, but will not kill the target.
Stepping
It is essential for any debugger to have a mechanism to step into, over, and out of code. The Nuclide Debugger provides stepping functionality with shortcuts within the Debugger itself and via the keyboard.

Evaluation
The Nuclide Debugger supports REPL via the Console tab.
When you hit a breakpoint during your debugging session, you can use the Console to write expressions, call functions, etc. using the current state of the program at the breakpoint.
For Hack and PHP debugging, hitting a breakpoint is not necessary to use the REPL support of the Nuclide Debugger. If you do not hit a breakpoint, then REPL is run in the global context as opposed to the current stack frame if a breakpoint is hit.
For LLDB-based debugging, REPL runs LLDB debugger commands as opposed to evaluating code in the Debugger.
Example
Here we have a breakpoint before printing out the sum of the two global variables num1 and num2.
This shows printing out the values of the global and local variables, writing simple expressions,
calling a function in another module (math.add()), and inspecting objects.

Language Specific Debugging
While the general process for debugging in Nuclide is similar, there are platform and language specific debugging workflows that require discussion and illustration.
Platform Specific Debugging
Buck projects can be more easily debugged via the Task Runner.
