Health Statistics
Nuclide uses computing resources. We try to keep the resource usage as low as possible. One of the features of Nuclide is a health monitor that allows you to track CPU, memory, heap usage and other statistics.
Toggling
To open the Health tab in the main Editing Area, you have four primary options:
- The
Ctrl-Option-Shift-H(macOS) orCtrl-Alt-Shift-H(Linux) keyboard shortcuts - The Nuclide toolbar
- The Command Palette
Statistics
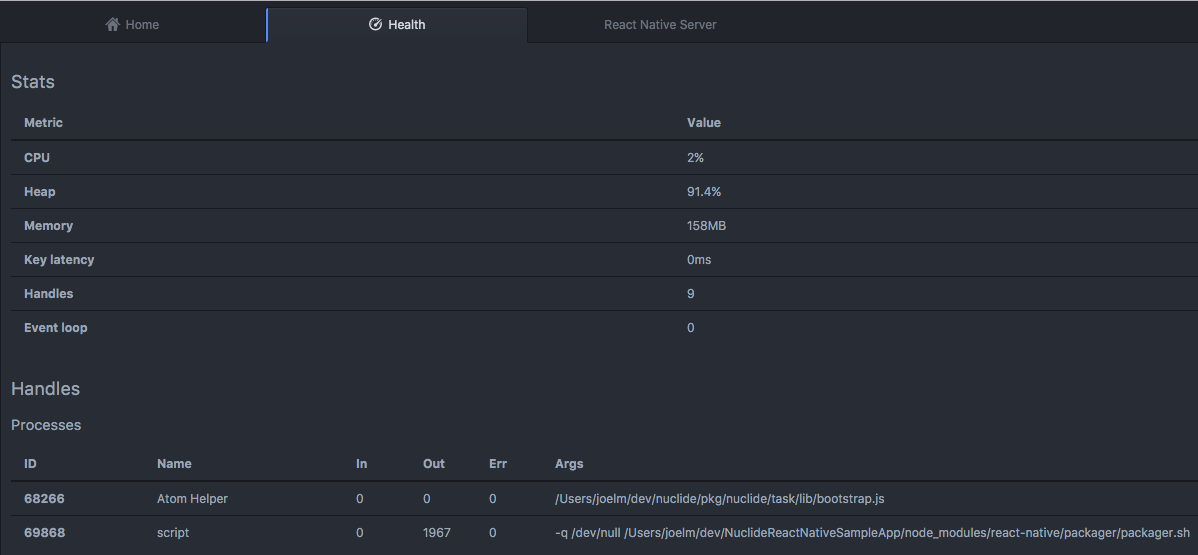
The following statistics are shown in the Nuclide health monitor. If you have multiple Nuclide sessions open, the statistics are per session and not a combination of all sessions.
- CPU: How much CPU Nuclide is using.
- Memory: How much memory Nuclide is using.
- Heap: How much of the memory heap given to Node by V8 is being used by Nuclide.
- Key Latency: How much time between a key press and the event to occur within Nuclide.
- Handles: The number of active handles that still exist in Nuclide.
- Event Loop: How many pending requests that Nuclide has.
The last two statistics are reported by the underlying Atom renderer process and indicate how many processes, handles, and outstanding activities are currently being managed by Node.
Also shown are the processes that have been spawned by Nuclide since it has been running, including process ID (PID), bytes received, sent and the number of errors from the process.
These statistics are provided by Node’s process APIs.