Task Runner
Nuclide provides the Task Runner toolbar for building, running, testing, and debugging projects.
Buck
Nuclide supports the Build, Run, Test, and Debug workflows for Buck, matching the corresponding Buck command-line tasks.
Your project must contain a
.buckconfigfile for the Buck tasks to be available in the Task Runner.
Click the Toggle Task Runner Toolbar button on the Nuclide toolbar to display options for building, running, testing, and debugging your Buck project.
Build
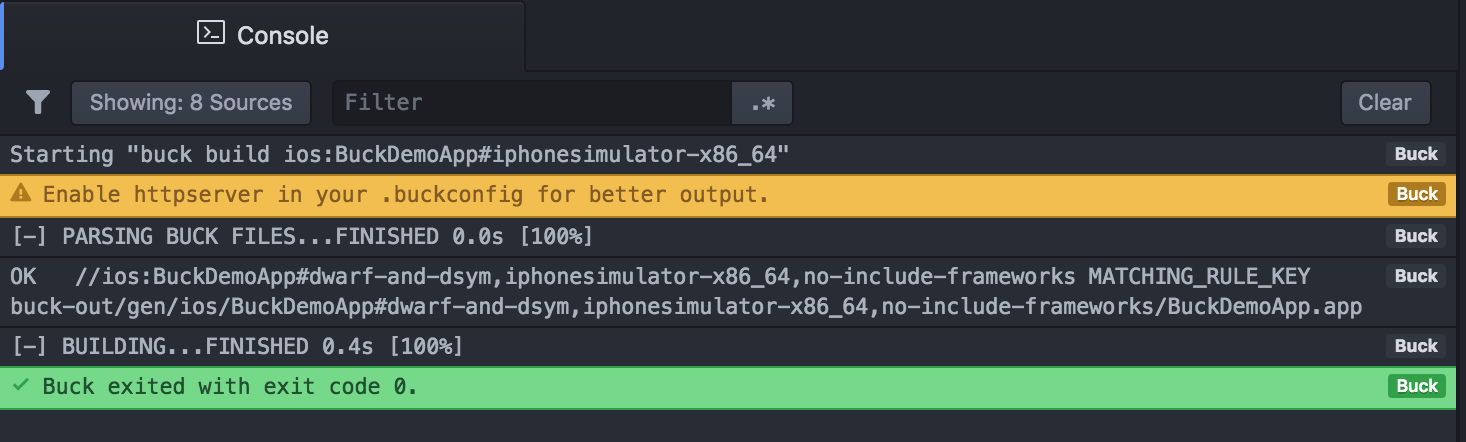
The Build task invokes buck build,
displaying build output in the Console below the Editing Area.
In the Task Runner toolbar’s text box, type in the name of the build target exactly
as you would specify on the command-line, i.e., //path/to/dir:target_name#flavor.
The usual leading
//is optional.
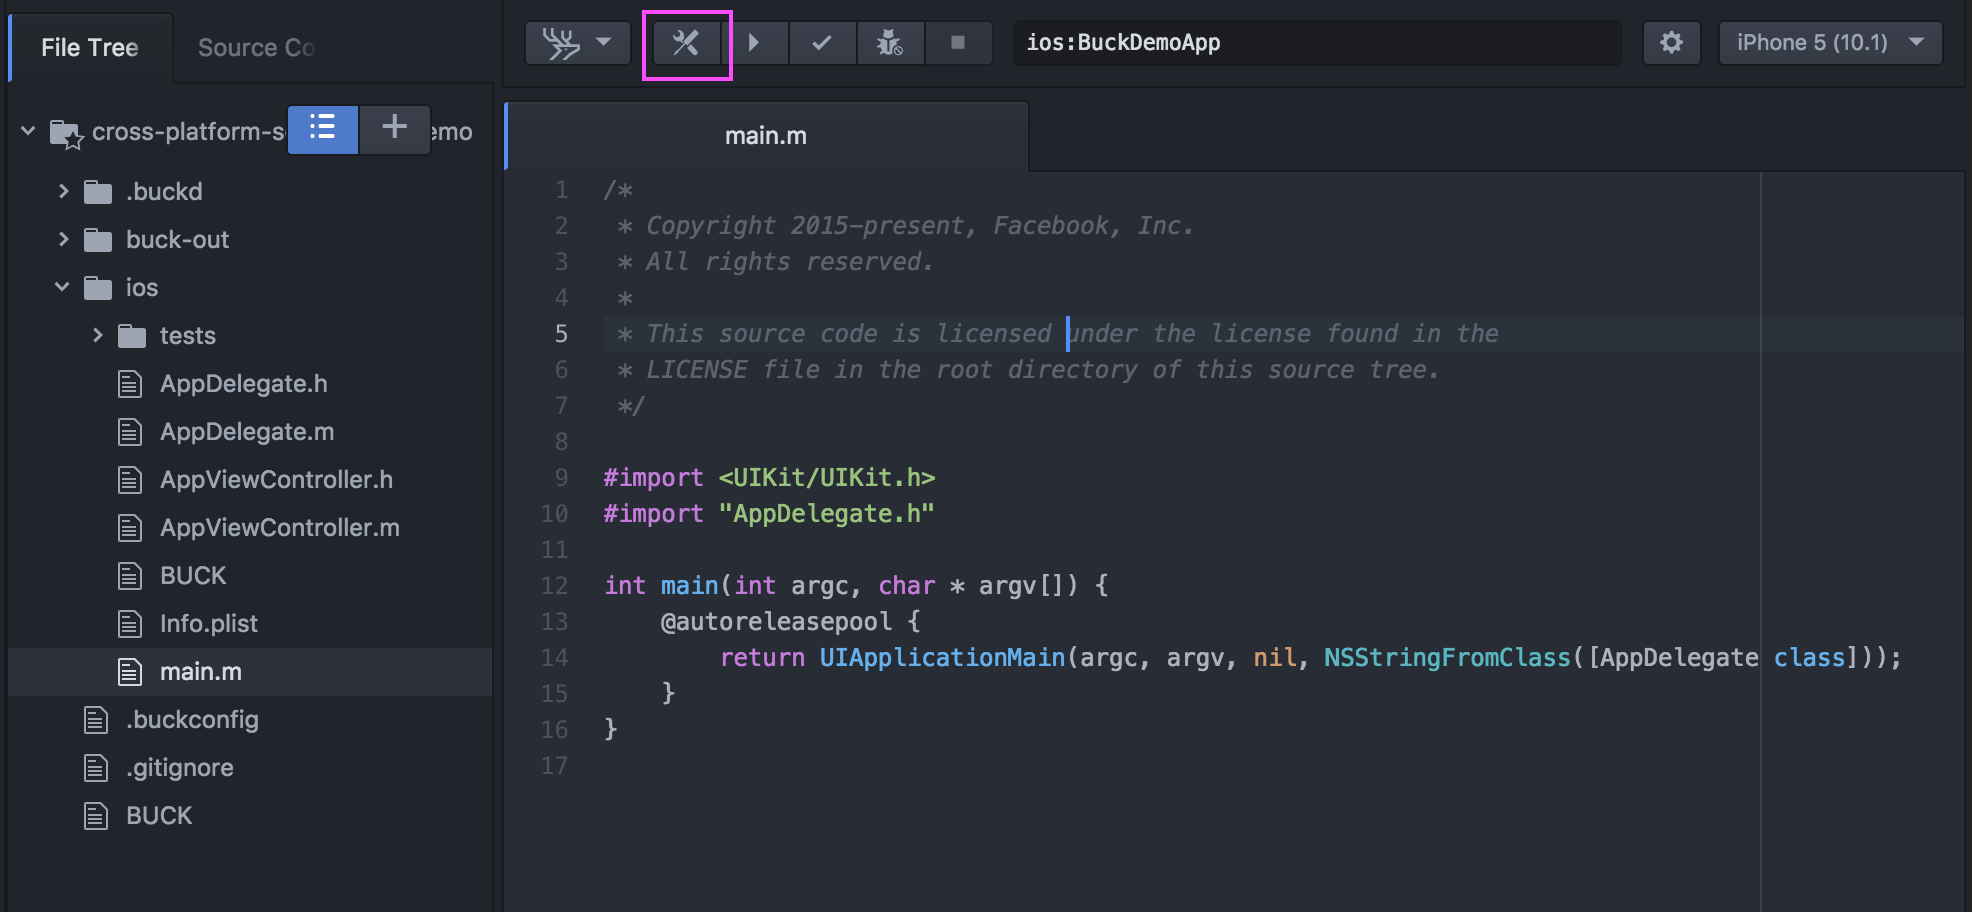
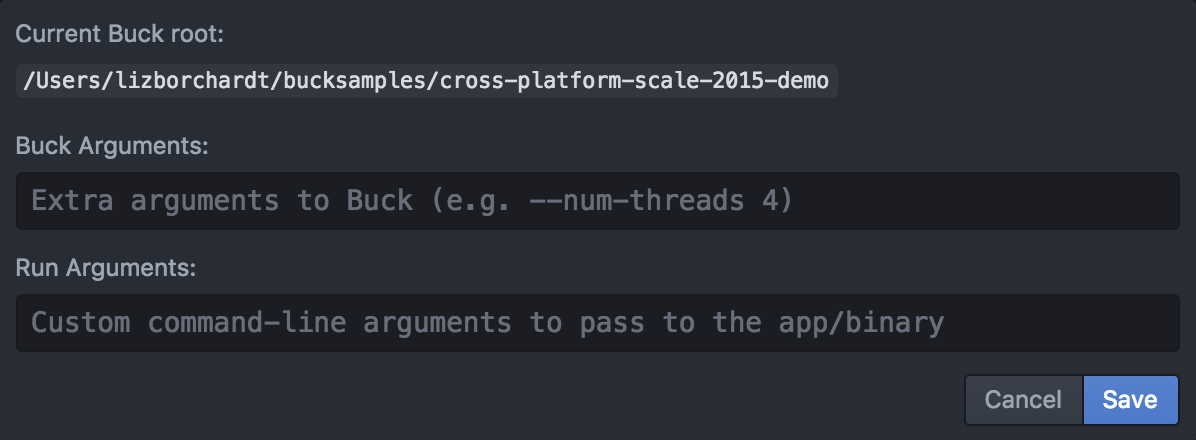
Clicking on the Settings button (i.e., the gear icon) opens a dialog where you can provide extra flags to Buck.
Upon clicking the Build button (i.e., the crossed tools icon), build progress displays via a blue progress bar below the toolbar and also periodically via messages in the Console.
Click the Stop button (i.e., the square icon) at any time to cancel an ongoing build.
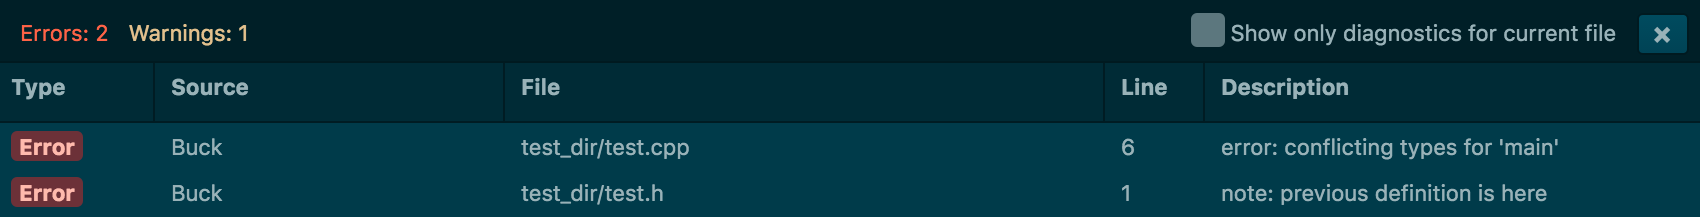
C++ compilation errors will appear in both the Console and the Diagnostics Table. Buck diagnostics are cleared upon triggering a new build.
Run
The Run task is only enabled for iOS and Android application targets (apple_bundle, android_binary, and apk_genrule rules). It invokes buck install --run and builds, installs, then runs the app. Build output will be reported as documented in the Build workflow section above.

The iOS simulator type can be explicitly selected via the drop-down menu to the right of the toolbar’s Settings button (i.e., the gear icon).
Test

The Test task invokes buck test, building and running valid test targets (e.g., cxx_test).
Build output will be reported as documented in the Build workflow section above.
Debug

The Debug task is only enabled for the following target types:
- iOS applications (
apple_bundle) - C++ unit tests (
cxx_test) - C++ binaries (
cxx_binary)
The LLDB debugger is invoked after a successful build in all three cases, but with slight variations.
iOS Applications
For iOS applications, the Debug task invokes buck install --run --wait-for-debugger, then attaches LLDB to the simulator process once the app starts.
As with the Run task, the iOS simulator type can be selected from the drop-down menu to the right of the toolbar’s Settings button (i.e., the gear icon).
C++ unit tests
For C++ unit tests, LLDB is launched against the unit test binary with the args and env parameters specified by the cxx_test target after a successful buck build.
C++ binaries
For C++ binaries, LLDB is launched directly against the output binary after a successful buck build. Extra launch arguments can be specified using the Settings button (i.e., the gear icon).
Swift
The Task Runner toolbar can build Swift packages and run their tests.
Your project must contain a
Package.swiftfile for the Swift tasks to be available in the Task Runner.
Click the Toggle Task Runner Toolbar button on the Nuclide toolbar to display options for building or testing a Swift package.
Building a Swift package

Enter the path to a Swift package’s root directory, then click the Build button (i.e., the crossed tools icon) to build the package. (This path is not needed if your project’s working root contains a Swift package.) Build output is displayed in the Console below the Editing Area.
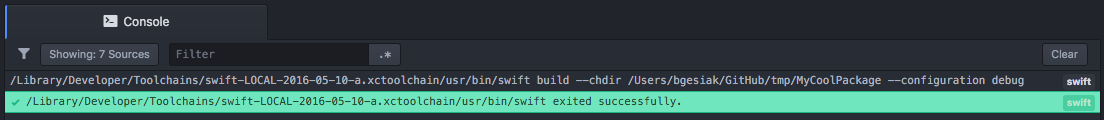
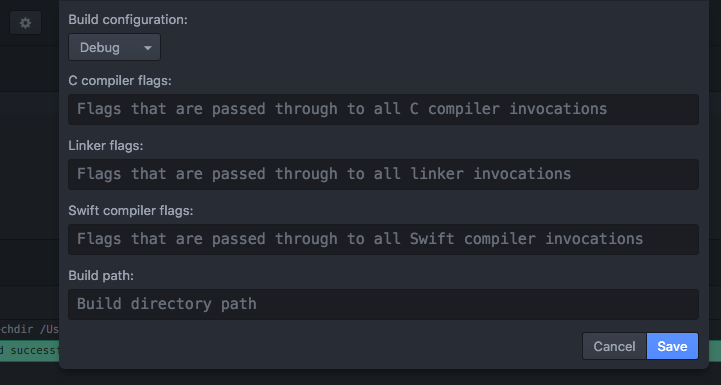
You can customize build settings, such as whether to build the package in a Debug or Release configuration, by clicking the Settings button (i.e., the gear icon) to the right of the toolbar’s text box.
Running a Swift package’s tests

Enter the path to a Swift package’s root directory, then click the Test button (i.e., the checkmark icon) to run the package’s tests. (This path is not needed if your project’s working root contains a Swift package.) Test output is displayed in the Console below the Editing Area.
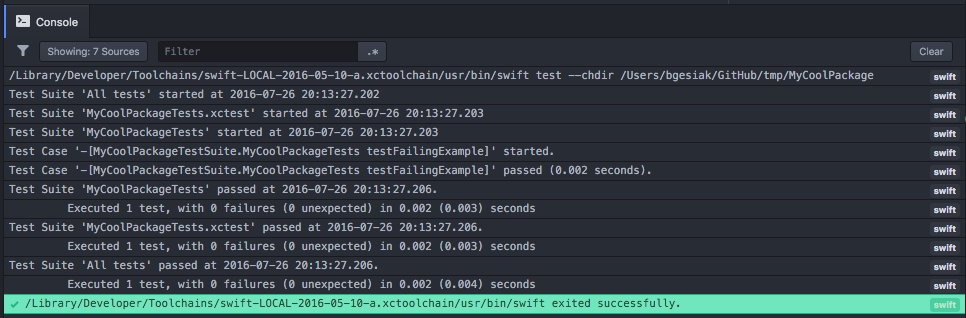
Clicking the Settings button (i.e., the gear icon) to the right of the toolbar’s text box displays additional settings for running your Swift package’s tests.
HHVM Debug Toolbar
Nuclide provides an HHVM toolbar in the Task Runner for debugging Hack projects. You can launch the toolbar by clicking the Toggle Task Runner Toolbar button in the Nuclide toolbar.

You must have a Hack or PHP file open to successfully launch the toolbar.
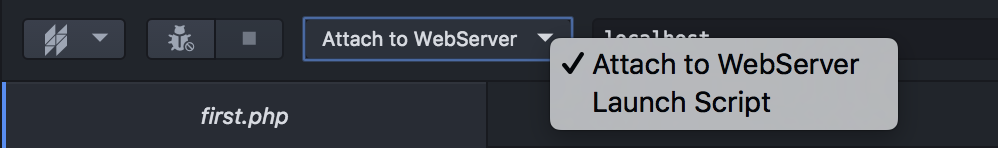
You can choose either Attach to WebServer or Launch Script from the drop-down menu. If you select Attach to WebServer, the text box will fill automatically with the server to which you are connected. If you select Launch Script, the text box will fill automatically with the path of the open file.
Set breakpoints in your code.
Click the Debug button (i.e., the bug icon) to open the Debugger; it will stop at the first breakpoint.
You can then follow the basic Debugger information and use the additional features of the Console, Evaluation, Filtering and other HHVM-specific debugging settings to debug your code.
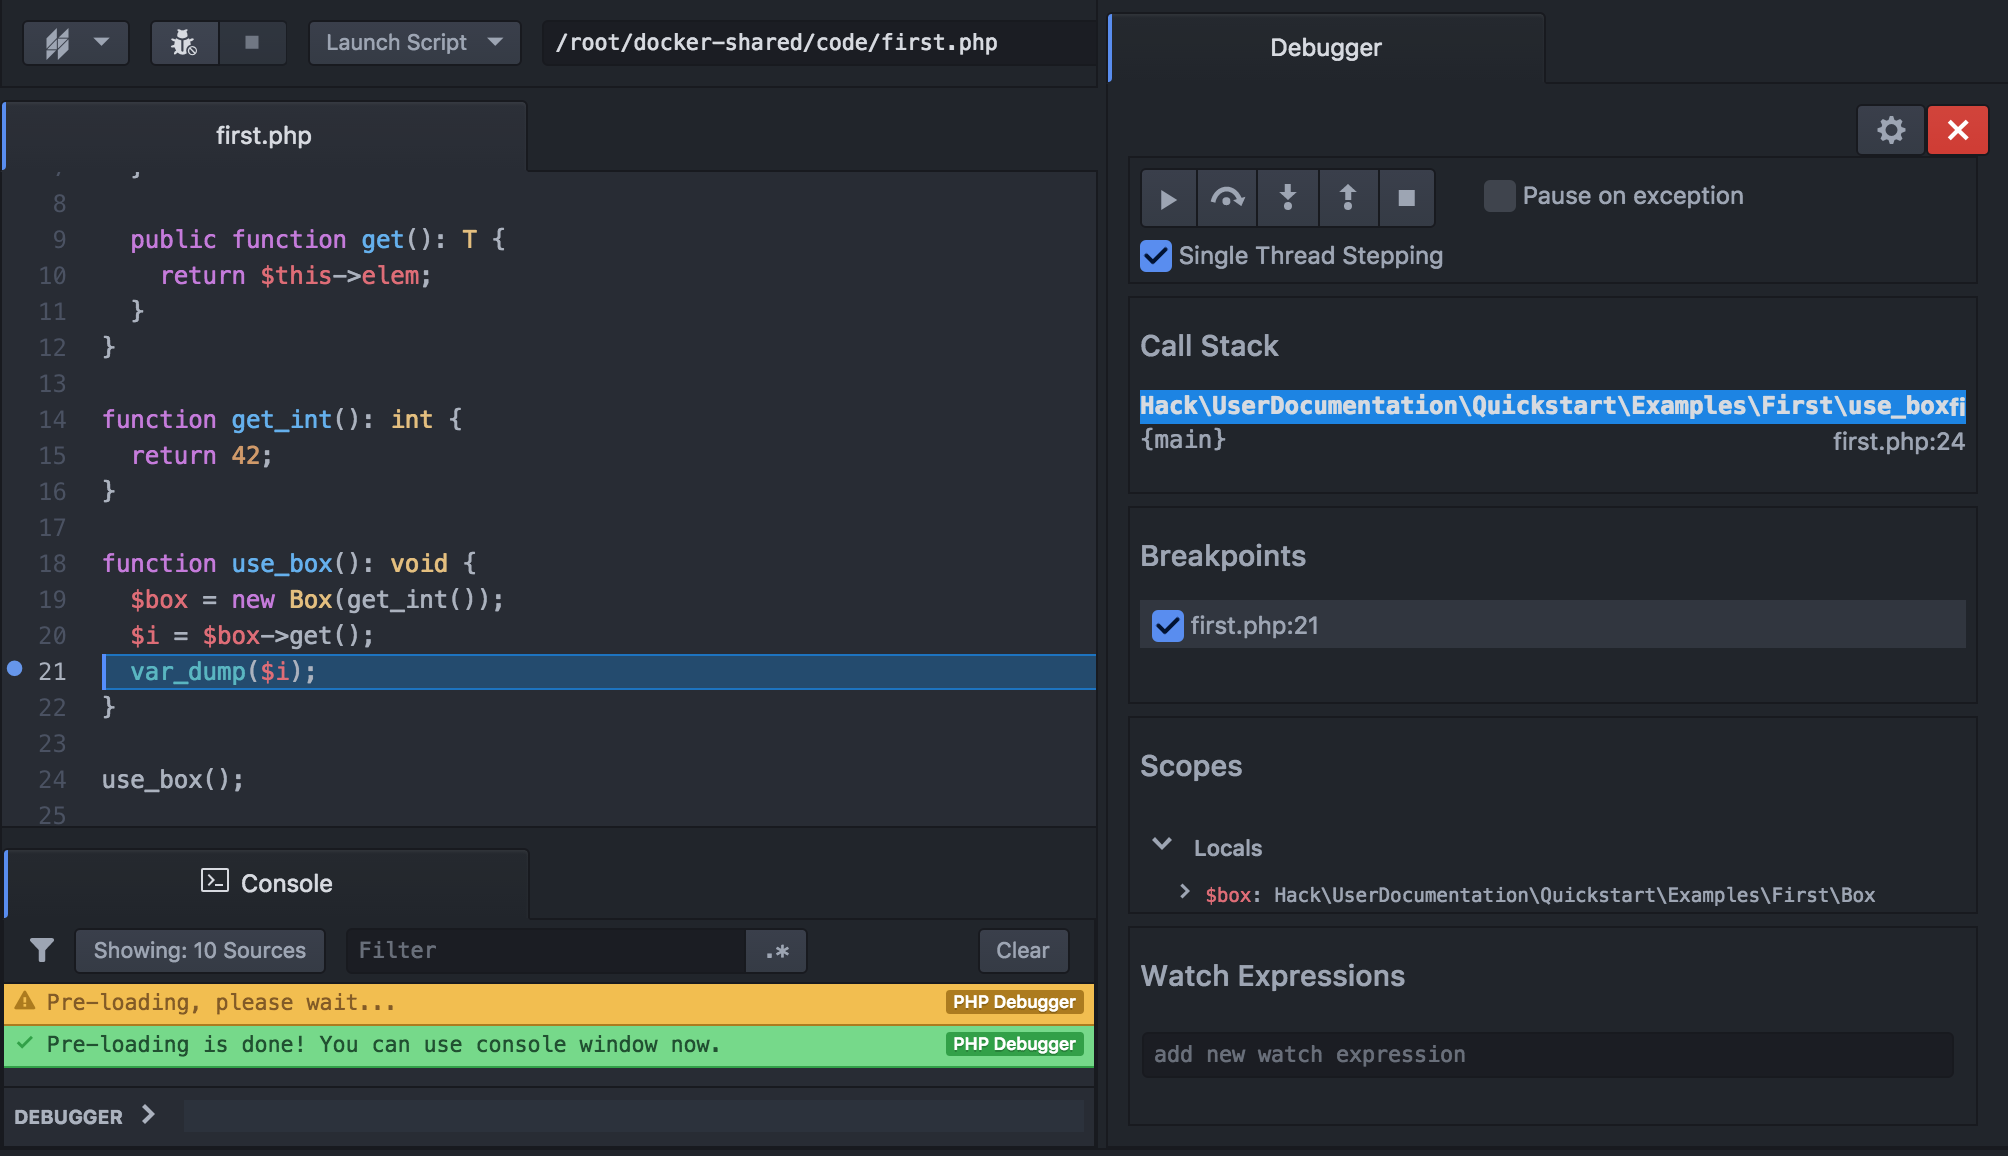
In both the script and server launching/attaching scenarios, the line at which you’ve set a breakpoint will highlight in blue when the breakpoint is hit. When this happens, execution of your code is paused and you can use the Debugger Controls to step, evaluate expressions, inspect the current call stack, etc.